VARCHAR/NVARCHAR sizing/oversizing

It was not so long ago, we discusses with my colleagues what is the best VARCHAR/NVARCHAR sizing since these string data types allocate space in pages based on char-count stored in dynamically.

I remember that there is a saying that you should size our VARCHAR/NVARCHAR columns with size you really need. But from first sentence of this post and MSDN definition it seems that it does not matter. These data types could adapt on string you put in. Let’s have look on its little bit closer. This could not be answered by an easy way.

Create two tables with columns, type of VARCHAR and different size for each table. In my sample I created one with VARCHAR(20) and another one with VARCHAR(1000). (Do not use VARCHAR(MAX) since it is another story, I will describe in one of my next POSTs).

CREATE TABLE _varchar_20( id VARCHAR(20))
CREATE TABLE _varchar_1000( id VARCHAR(1000) )

Fill the tables with data with text size corresponding to the table column with the lover VARCHAR size. In my case 20, it means that the second table column will be oversized.

INSERT INTO _varchar_20
SELECT REPLICATE('1',20)
FROM sys.objects a
JOIN sys.objects b ON 1=1
JOIN sys.objects c ON 1=1

INSERT INTO _varchar_1000
SELECT REPLICATE('1',20)
FROM sys.objects a
JOIN sys.objects b ON 1=1
JOIN sys.objects c ON 1=1

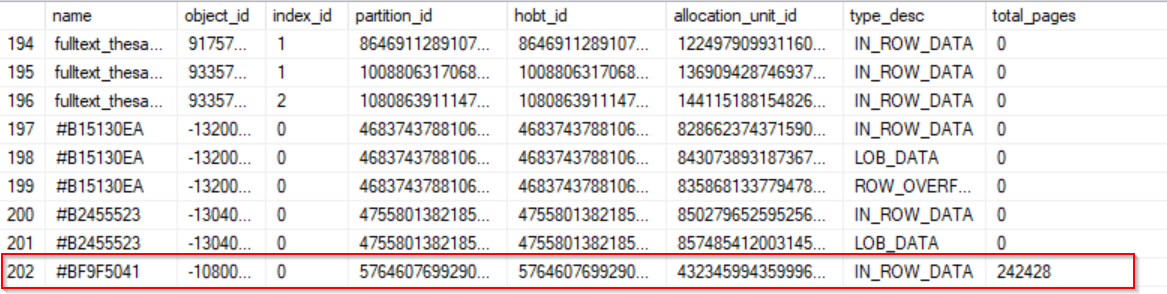
Let’s check how tables differs from the storage point of view.

SELECT so.name, 
so.object_id,        sp.index_id,        sp.partition_id,        sp.hobt_id,        sa.allocation_unit_id,        sa.type_desc, sa.total_pages FROM sys.objects so JOIN sys.partitions sp on so.object_id = sp.object_id JOIN sys.allocation_units sa on sa.container_id = sp.hobt_id WHERE so.name IN ('_varchar_20','_varchar_1000')

As we can see there is no different. Number of allocated pages is the same for all tables.

Pages count
Picture 01 – Pages count

Now run simple select queries and compare execution plans to check if there is no impact on query execution.

SELECT * FROM     _varchar_20
SELECT * FROM _varchar_1000

It seems that both execution plans are the same at first look.

Simmple query plan comparation
Picture 02 – Simmple query plan comparation

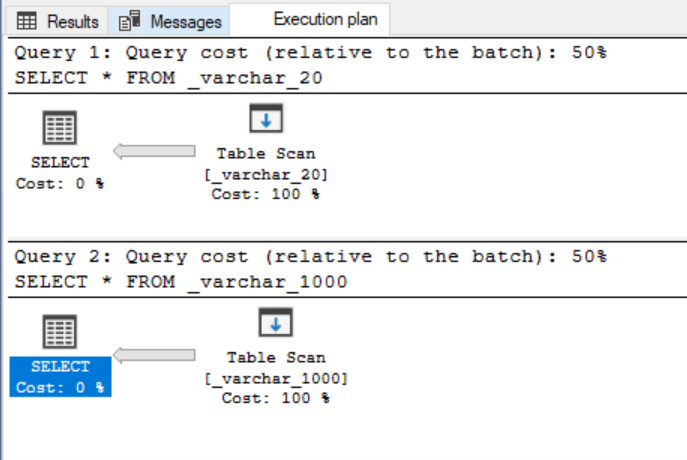
The only one counter differs – Estimated row size but it has evidently no impact on query execution.

 Estimated Row Size
Picture 03 – Estimated Row Size

Estimated Row Size

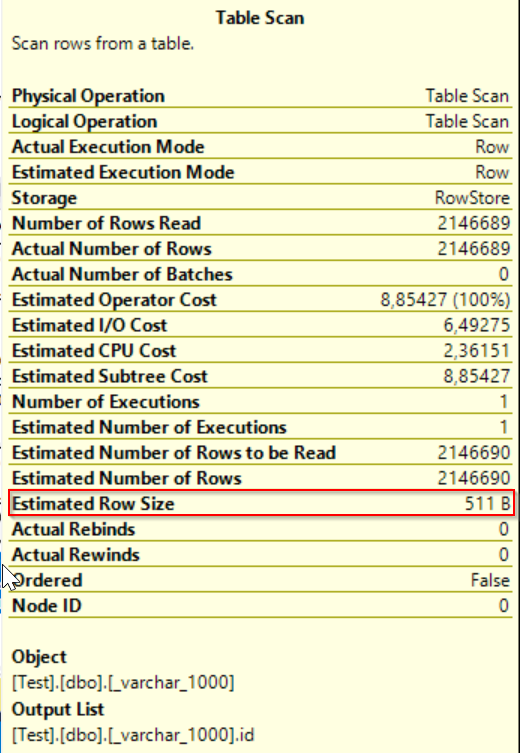
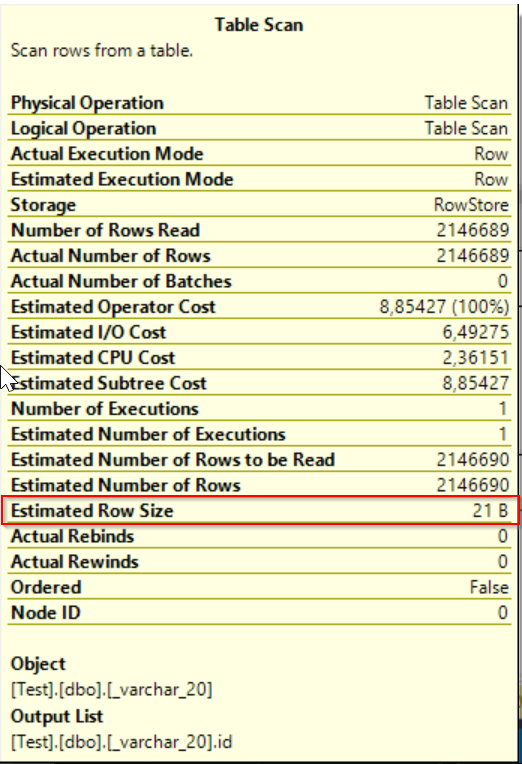
04 – Estimated Row Size

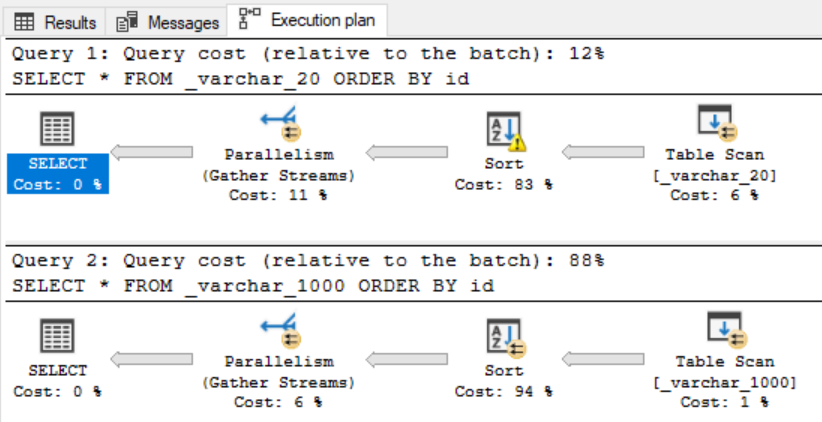
Now we could say that sizing of VARCHAR/NVARCHAR has no impact on storage and query execution. BUT let’s modify our queries with sort operators and run them again.

SELECT * FROM     _varchar_20 ORDER BY id

SELECT * FROM _varchar_1000 ORDER BY id

As you can see query getting data from smaller column VARCHAR/NVARCHAR sizing run with less query costs and pefroms much better. What happened?

query plan comparation
Picture 05 query plan comparation


Click on SELECT operator to see its properties for both queries. As you can see there appeared row with MEMORY GRANT meaning that query asked for memory reservation based on Estimated row count as I mentioned above. Sometimes optimizer does not look at the data really stored in objects and checks statistics or catalog schema info, etc. as in this case.

Picture 06 – memory grant

 memory grant

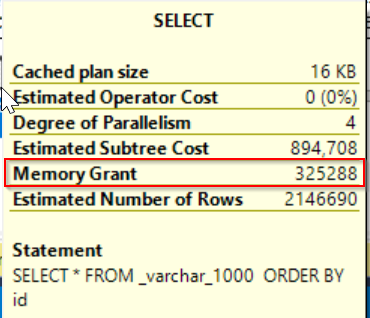
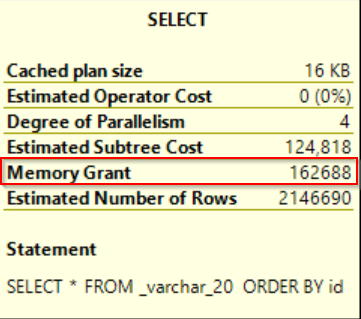
Picture 07 – memory grant

So we could see that little change in query caused different query plans and costs estimation with better performance for smaller VARCHAR/NVARCHAR sizing. 

My recommendation would states that it is better to size VARCHAR/NVARCHAR without oversizing columns when it is not really necessary.  Of course there could be scenarios that you expect that data could increase in time. But to increase length of your VARCHAR/NVARCHAR column is still easier job that if you have to reduce it. 

It would be interesting to take a look at this theme from more perspectives. I will continue with this topic in my next posts where I extend this theme to indexes, predicates, etc.  Stay tuned!


Table variable myths

There are lots of myths regarding Table variable . You can find lots of theories that Table variable has no impact on transaction log since it is out of scope of transaction. You can find   lots of articles that Table variable is stored in memory too. I decided to do some tests to see if Table variable could have impact on transaction log and if it is physically created in tempdb .

Important note at the beginning. Try bellow mentioned queries on your test environment only! Do not run it on production. I used SQL server 2017 installed on my laptop locally. It is better that I could eliminate possible impact of other processes running on SQL Server.

In my sample I created simple Table variable filling with lots of data in while cycle. In another query window I will use undocumented sys.fn_dblog function to read what is happening in transaction log.

I sized transaction log file of temporary table at very low value – 4MB. We will see if insert to Table variable can increase its file size.

Log size
Picture 01 Log size

Let’s clean up transaction log of temporary table first. Look at script where sys.fn_dblog function is called, to see how the transaction log looks like. There are only three records returned.

CHECKPOINT 
SELECT  * FROM sys.fn_dblog(NULL, NULL)

empty tempdb transaction log
Piture 02 empty tempdb transaction log

Execute script with insert rows to Table variable and do it in neverending while cycle, like I do. The main issue was to have query still running while getting data from log. Since the query was stopped, I was not able to get needed data from the log function. So it is important that the query with table variable you would like to analyze will be still running while getting data from transaction log in another query window.

SELECT [Transaction Name], [spid], [Xact ID], f.[Page ID], f.[parent transaction id], [Transaction ID],[Transaction Name] ,AllocUnitName,*
FROM sys.fn_dblog(NULL,NULL) f WHERE [SPID]=56

Get SPID of inserting query and run above mentioned query in new query window with SPID you get.  In output you can see name of Temporary table we created as name of transaction. We are lookingn for Transaction Name wiht AllocPages.

 Get log data based on parent transaction
Picture 04 Get log data based on parent transaction

Take Parent Transaction ID from the row where column Transaction Name = AllocPages and change predicate to select records base on Transaction ID

SELECT [Transaction Name], [spid], [Xact ID], f.[Page ID], f.[parent transaction id], [Transaction ID],[Transaction Name] ,AllocUnitName,* FROM sys.fn_dblog(NULL,NULL) f WHERE [Transaction ID]='0000:00002622'

Here we can see temporary table name in Allocation unit name column. The name of Allocation unit uses the same convention like for local temporary table. It really seems that  Table variable is physically created in tempdb as Temporary table.

Result from log filtered by transaction ID
Picture 05 Result from log filtered by transaction ID

Another view could be made with Allocation units, where you can check how many pages were used in our transaction in Table variable.

SELECT so.name, so.object_id, sp.index_id, sp.partition_id, sp.hobt_id, sa.allocation_unit_id, sa.type_desc, sa.total_pages
FROM sys.objects so
JOIN sys.partitions sp on so.object_id = sp.object_id
JOIN sys.allocation_units sa on sa.container_id = sp.hobt_id

Get data from allocation units and partitions
Picture 06 Get data from allocation units and partitions

Now we verify that the temporary table is connected to our Table variable and if so, that the data are stored in tempdb. We check that data inserting to Table variable can be found in pages of tempdb data files. I took first Page ID from row with Operation of LOP_MODIFY_ROW type.  It is highlighted on picture 05 – 0005:0000bd90. First number 0005 corresponds to tempdb file ID, the second number converted from hex to dec 48528 is page ID.  Use DBCC command  bellow to get SGAM page to get info where pages with data are placed.

DBCC PAGE(2,5, 48528 , 3) WITH TABLERESULTS;

We put 2 as first parameter meaning tempdb database ID. The second  parameter 5 is database file ID, 48528 number of page, and last parameter 3 output style.  Bellow we get list of ranges where pages are allocated.

List allocated pages
Picture 07 List allocated pages

Let’s choose one page from above listed allocated pages range- highlighted. I choose page 48537 using DBCC command again.

DBCC PAGE(2,5, 48537 , 3) WITH TABLERESULTS;

Look at details from DBCC output bellow. At Field column we can find id, testdata column name defined in our Table variable. In VALUES column get data already inserted.

page detail
Picture 08 page detail

We verified that Temporary table dbo.#BC836344 is Table variable we declared in our testing queryNow look at transaction log size. We see that tempdb log file size  increased.

Transaction log size
Picture 09 Transaction log size

When stopped the query inserting data to table variable we can see that the temporary table  disappeared from Transaction log.

Transaction log
Picture 10 Transaction log

Finally we checked that

  • Table variable is actually temporary table created in  tempdb , persisted during query run.
  • we could get inserted data by accessing pages from tempdb
  • DML operation on Table variable have impact on transaction log of tempdb
  • It can even cause unexpected increase of transaction log size

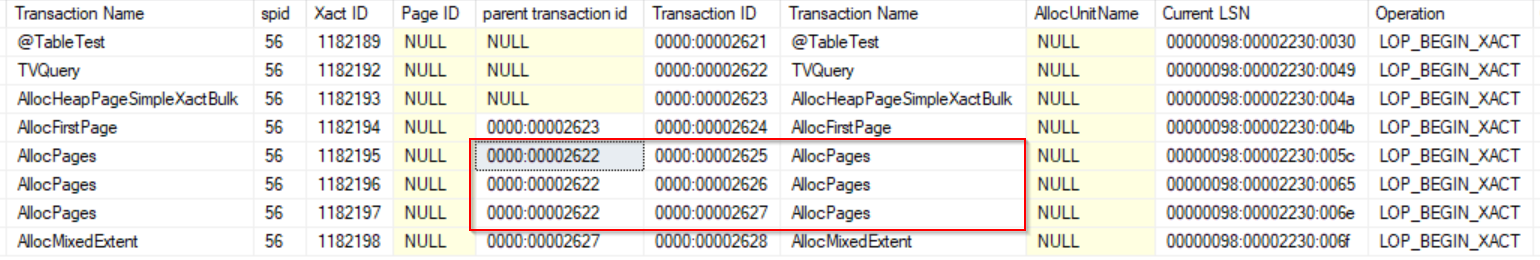
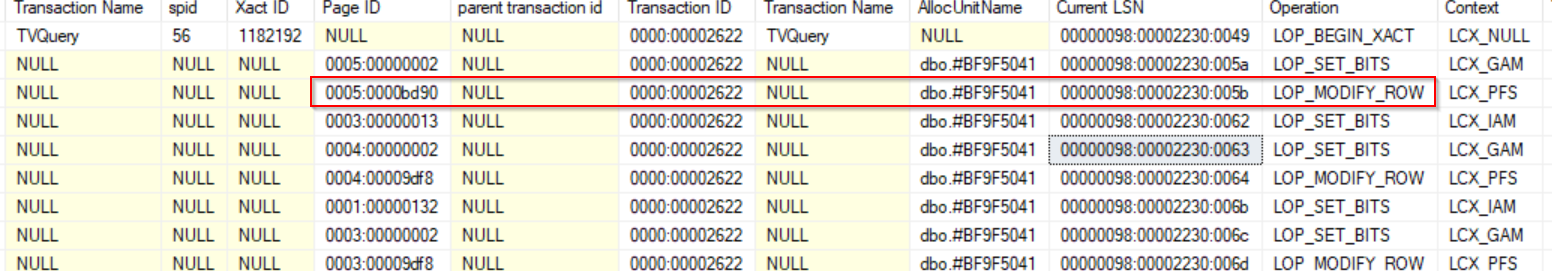
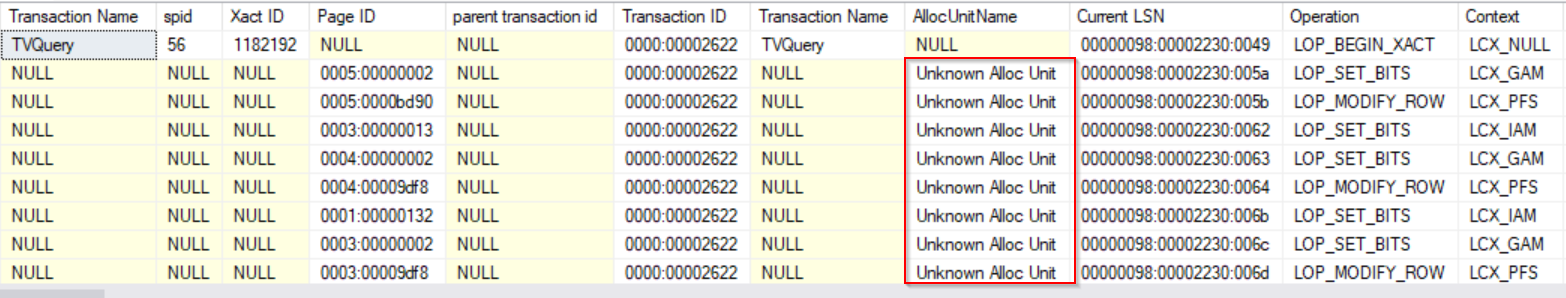
What is not still clear to me, or maybe I dont see it, why it is implemented this way. Table variable is defined like out of transaction scope table by Microsoft. Why there is a need to write data to transaction log, it seems useless to me. 

With this post I proved that Table variable is actually Temporary table, created in tempdb with some specific behavior. Next time could be insteresting to compare above mentioned sample with local Temporary table to see the differences in transaction log and pages allocation. Stay tuned.

SQL Server Traces

I would like to target in next posts on comparing Extended Events with Profiler Traces. In this post we will look at basic T-SQL routines creating and handling SQL Traces. You can use SQL Profile tool too. Open Management Studio -> Top menu -> Tools -> SQL Server Profiler.

Just few briefly words about SQL Traces. It is used to track SQL Server events triggered in system. Such a tool can be used to monitor SQL Server deadlock, performance tuning, auditing security area, etc.

Deeper comparation with extended events will be mentioned in one of my next posts.

As extended events SQL Server trace have few options:

Data column is an attribute of an event that can be collected in trace. Not all attributes are available for all events. Each event has its own set of attributes. Usefull queries for traces and their binding to columns bellow.

SELECT * FROM sys.trace_columns
SELECT * FROM sys.trace_event_bindings

Event is an object that is triggered in system and tracked by trace. The event contains data columns that can be collected and reported in trace.

SELECT * FROM sys.trace_events
SELECT * FROM sys.trace_categories

Trace is actually a collection of events and data returned by the Database Engine. To get info about traces and their options use following query.

SELECT * FROM sys.traces

Trace filters are predicates limiting collected events in a trace. To get info of filters set to concrete trace use following function with ID of trace as parameter.

SELECT * FROM sys.fn_trace_getfilterinfo(2)

To collect trace data by T-SQL you have to do few steps.

  1. create trace – to get its ID and define attributes like destination etc.
  2. set events to trace – events that will be collected by trace
  3. set filters if requested – to filter event data
  4. run/stop/remove trace

See detail info bellow.

To create trace use following code.

declare @TraceID int
declare @maxfilesize bigint
declare @rollOver    int = 2
declare @path NVARCHAR(100) = N'C:\Trace\Test'
set @maxfilesize = 1000000 
declare @maxfilecount INT=20
Exec @rc = sp_trace_create @TraceID output, 	@rollOver /*enable rollower*/, @path, @maxfilesize, NULL ,@maxfilecount
if (@rc != 0) goto error

The most important parametres are path, targeting destination of trace data. There are also possibilities to get data outputu to database table or use SQL server profiler application. In example above we use filesystem destination. @TraceID parameter gets ID of trace assigned by system. You use this ID when referencing trace in other routines. You can get ID from system table sys.traces too.

Other parameters defined in our examples are @maxfilesize – you define size of destination file in magabytes. If trace data achieve defined maxfilesize, the trace will be stopped.

In case that you would like to have trace data distributed to more files, because of faster quering, you can set rollover functionality as you can see on our example.  Value set for @rollOver  parameter tells the trace to establish new file one the previous one is full. Through this parameter you can set more options, you can see this link to get detail info.

By creating trace with this procedure we still not getting data. We have to set the trace which data should be collected. So use another one stored procedure to set this option.

declare @on bit
declare @eventID INT = 14
declare @TraceID INT = 2
set @on = 1
exec sp_trace_setevent @TraceID, @eventID, 10, @on
exec sp_trace_setevent @TraceID, @eventID, 3, @on
exec sp_trace_setevent @TraceID, @eventID, 11, @on
exec sp_trace_setevent @TraceID, @eventID, 7, @on
exec sp_trace_setevent @TraceID, @eventID, 8, @on
exec sp_trace_setevent @TraceID, @eventID, 12, @on
exec sp_trace_setevent @TraceID, @eventID, 14, @on
exec sp_trace_setevent @TraceID, @eventID, 35, @on

The first parameter @TraceID is used to set trace ID. @eventID is ID of event you can find in system table  sys.trace_events. In our case eventid 14 is set. It means Audit Login data are collected.

As next parameter you set columns, attributes you would like to collect. You can get list of columns with their ids from system table sys.trace_columns or from MSDN web here. For example on first row where sp_trace_setevent is executed we set 10 which means that application name attribute is collected.

The last parameter for sp_trace_setevent procedure is bit marker. All columns are disabled by default, by specifiying bit to 1 we enable the attribute to be collected.

To filter traces use stored procedure sp_trace_setfilter.

sp_trace_setfilter [ @traceid = ] trace_id   
          , [ @columnid = ] column_id  
          , [ @logical_operator = ] logical_operator  
          , [ @comparison_operator = ] comparison_operator  
          , [ @value = ]

Define @traceid to specify to which trace you would like to apply filter. By specifying @columnid you define on which attribute will be filter applied. @logical_operator means that OR (1), AND (0) filter logic will be applied. @comparison_operator (LIKE, equal, not equal, etc.) defines comparison_operator by its IDs you can find here . IN @value we define value to which should be column compared.

exec sp_trace_setfilter 2, 11, 0, 6,N'sa'

In filter above we set that on our trace monitoring Audit Login event, SA user will be filtered in the trace.  Trace=2, LoginName=11, 0 =AND operator, 6 = LIKE operator, N’sa’ value to be compared.

To handle trace activity, state, there is sp_trace_setstatus stored procedure implemented. See examples bellow.

exec sp_trace_setstatus 2, 0 /*stop trace*/
exec sp_trace_setstatus 2, 1 /*run trace*/
exec sp_trace_setstatus 2, 2 /*remove trace - has to be stoped first*/

Next time look at traces in more detail and compare them with Extended Events. Stay tuned!