Insert exec

I was thinking about difference between INSERT and INSERT-EXEC statement from performance perspective since I saw lots of post announcing that you should avoid the second one mentioned (INSERT-EXEC). I decided to make few tests and look at this problematic from more angles to have better imagination about how these commands behave.

Testing scenarios:

  • Execution plan
  • IO stats and time stats
  • Extended events – statement completed event – row count
  • Transaction log behaviour
  • Transaction scope

Let’s create data structures for our tests:

First create tables for data insert

 CREATE TABLE dbo.InsertTable1 (id INT , [data] VARCHAR(255))
CREATE TABLE dbo.InsertTable2 (id INT , [data] VARCHAR(255))

Create two persistent temporary tables we will fill inside procedures we create:

CREATE TABLE dbo.TempTable1 (id INT , [data] VARCHAR(255))
CREATE TABLE dbo.TempTable2 (id INT, [data] VARCHAR(255))

Create objects we use to test:

The first one is stored procedure inserting data to InsertTable1 table – insert statement is part of stored procedure definition.

 CREATE PROCEDURE dbo.InsertData
   AS
INSERT INTO dbo.TempTable1
SELECT TOP 100000 a.object_id,REPLICATE('a',10 ) a
  FROM sys.objects a
  JOIN sys.objects b ON 1=1

 INSERT INTO dbo.TempTable2
 SELECT TOP 100000 a.object_id,REPLICATE('a',10 ) a
  FROM sys.objects a
  JOIN sys.objects b ON 1=1 

  INSERT INTO dbo.InsertTable1
  SELECT * FROM dbo.TempTable1
  UNION ALL
  SELECT * FROM dbo.TempTable2

The second one batch inserts data to InsertTable2 table – insert is realized by INSERT – EXEC statement. 

EXEC ('INSERT INTO dbo.TempTable1 SELECT TOP 100000 a.object_id,REPLICATE('a',10 ) a 
FROM sys.objects a
JOIN sys.objects b ON 1=1

INSERT INTO dbo.TempTable2

SELECT TOP 100000  a.object_id,REPLICATE('a',10 ) a
FROM sys.objects a
JOIN sys.objects b ON 1=1

INSERT INTO dbo.InsertTable1
SELECT * FROM dbo.TempTable1
UNION ALL
SELECT * FROM dbo.TempTable2
')

Execute satements to fill the data:

exec  dbo.InsertData

INSERT EXEC ('…') /*put exec part above*/

Cleaning statements – call it before statements executions

TRUNCATE TABLE dbo.InsertTable1
TRUNCATE TABLE dbo.InsertTable2
TRUNCATE TABLE dbo.TempTable1
TRUNCATE TABLE dbo.TempTable2
DBCC FREEPROCCACHE
DBCC DROPCLEANBUFFERS
CHECKPOINT

Switch IO stats/processing time /actual execution plan in studio on. Or put following commands:

SET STATISTICS IO ON
SET SHOWPLAN_XML ON
SET STATISTICS TIME ON

Run following extended event with result to file.

CREATE EVENT SESSION GetRowsCount ON SERVER
ADD EVENT transaction_log 
( ACTION (sqlserver.sql_text, sqlserver.tsql_stack, sqlserver.database_id,sqlserver.username)
)
,
ADD EVENT sql_transaction 
( ACTION (sqlserver.sql_text, sqlserver.tsql_stack, sqlserver.database_id,sqlserver.username)
)
,
ADD EVENT sql_batch_completed 
( ACTION (sqlserver.sql_text, sqlserver.tsql_stack, sqlserver.database_id,sqlserver.username)
)
ADD TARGET package0.event_file(
SET filename='C:\outputfile\outputfile2.xel')
ALTER EVENT SESSION GetRowsCount ON SERVER STATE = START
ALTER EVENT SESSION GetRowsCount ON SERVER STATE = STOP

DROP EVENT SESSION GetRowsCount ON SERVER

Statement completed event – counters

Queries touched 400000 rows. 100000 for each from the two temptables and 200000 for final insert. But in case of insert we can see from batch completed event that query touched 600000 instead of 400000. Look at table below to check other counters.

SELECT CAST (EVENT_data AS XML),
       CAST (EVENT_data AS XML).value('(/event/data[@name="batch_text"])[1]','NVARCHAR(100)')     AS batch_text,
       CAST (EVENT_data AS XML).value('(/event/data[@name="duration"])[1]','NVARCHAR(100)')       AS duration,
       CAST (EVENT_data AS XML).value('(/event/data[@name="physical_reads"])[1]','NVARCHAR(100)') AS physical_reads,
       CAST (EVENT_data AS XML).value('(/event/data[@name="logical_reads"])[1]','NVARCHAR(100)') AS logical_reads,
     CASt
(EVENT_data AS
XML).value('(/event/data[@name="row_count"])[1]','NVARCHAR(100)')
AS row_count
FROM sys.fn_xe_file_target_read_file('C:\outputfile\outputfile1*.xel',
'C:\outputfile\outputfile1*.xem',
null,null) 
WHERE object_name = 'sql_batch_completed' ;


Counter Insert Insert – exec
Writes 1350 2194
Duration 9149345 11984022
Row count 400000 600000
Logical Reads 471973 962908
Physical Rads 662 1238

As you can see INSERT – EXEC statements consume more resources than normal insert on same set of data.

How it is possible than INSERT – EXEC generates additional 200000 row counts and finally touched 600000 rows and we made inserts with 400000 rows at total?

IO stats

Let’s check IO stats and execution plan to see the difference.

Worktable in IO stats


On picture above you can see that with INSERT-EXEC statement Worktable is created, means that insert-exec uses tempdb to store result- set before final insert. So, there we see that is an additional impact on tempdb and tempdb transaction log too.
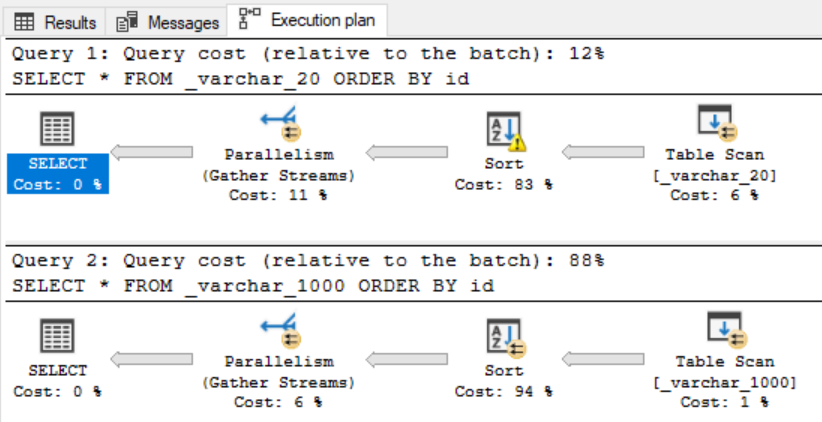
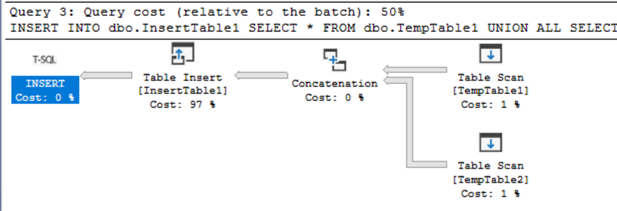
Execution plan

Execution plan - INSERT EXEC
Execution plan – INSERT EXEC


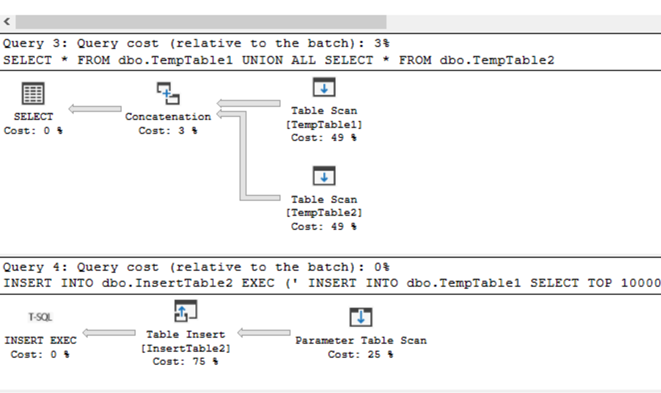
The difference in execution plan is as follow. With INSERT – EXEC you get two statements. The one for the result-set of EXEC and the second one for inserting the data.

Execution plan INSERT

Transaction log

Another perspective is the transaction scope behaviour. Let’s get data from transaction_log event to temporary tables first.

SELECT     CAST (EVENT_data AS XML).value('(/event/data[@name="log_record_size"])[1]','INT') logsize,
CAST (EVENT_data AS XML).value('(/event/@timestamp)[1]','datetime2') timestamp,
CAST (EVENT_data AS XML).value('(/event/data[@name="transaction_start_time"])[1]','datetime2') date_time,
CAST (EVENT_data AS XML).value('(/event/data[@name="database_id"])[1]','INT')    database_id,
CAST (EVENT_data AS XML).value('(/event/data[@name="transaction_id"])[1]','INT')    transaction_id,
CAST (EVENT_data AS XML).value('(/event/action[@name="sql_text"])[1]','VARCHAR(1000)')    sql_text ,
CAST (EVENT_data AS XML).value('(/event/data[@name="operation"])[1]','VARCHAR(1000)')    operation
INTO #t1
FROM sys.fn_xe_file_target_read_file('C:\outputfile\outputfile1*.xel', 'C:\outputfile\outputfile1*.xem', null, null)
WHERE object_name = 'transaction_log' ;

SELECT CAST (EVENT_data AS XML).value('(/event/data[@name="log_record_size"])[1]','INT') logsize,
CAST (EVENT_data AS XML).value('(/event/@timestamp)[1]','datetime2') timestamp,
CAST (EVENT_data AS XML).value('(/event/data[@name="transaction_start_time"])[1]','datetime2') date_time,
CAST (EVENT_data AS XML).value('(/event/data[@name="database_id"])[1]','INT')    database_id,
CAST (EVENT_data AS XML).value('(/event/data[@name="transaction_id"])[1]','INT')    transaction_id,
CAST (EVENT_data AS XML).value('(/event/action[@name="sql_text"])[1]','VARCHAR(1000)')    sql_text ,
CAST (EVENT_data AS XML).value('(/event/data[@name="operation"])[1]','VARCHAR(1000)')    operation
INTO #t2
FROM sys.fn_xe_file_target_read_file('C:\outputfile\outputfile2*.xel', 'C:\outputfile\outputfile2*.xem', null, null)
WHERE object_name = 'transaction_log' 
;

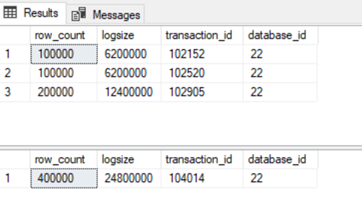
 Comparing following query outputs, we can see that insert-exec is scoped by one transaction against multiple individual transactions with normal insert.

SELECT COUNT(1) row_count,SUM(logsize) logsize,transaction_id,database_id FROM #t1 WHERE operation = '2LOP_INSERT_ROWS' GROUP BY transaction_id ,database_id

SELECT COUNT(1) row_count,SUM(logsize) logsize,transaction_id,database_id FROM #t2 WHERE operation = '2LOP_INSERT_ROWS' GROUP BY transaction_id, database_id
Transaction log output

Transaction scope

In case of INSERT-EXEC statement it should rollback all insert statements inside of EXEC statement when error occurs, because INSERT – EXEC is scoped by one transaction. In case of individual transactions in stored procedure, each insert is taken like separate transaction, so rollbacked will be insert resulting with error. Let’s try:

Change type of inserting value to INT column in second insert.

INSERT INTO dbo.TempTable2
SELECT TOP 100000 REPLICATE('a',10 ) REPLICATE('a',10 ) a
FROM sys.objects a
JOIN sys.objects b ON 1=1

Run testing queries again. As you can see in case of INSERT-EXEC statement there are no rows inserted in tables since rollback appears.

Conclusion:

While INSERT-EXEC statement still takes place in some scenarios, you should be aware of mentioned circumstances.

NOTICE: I would like to check that transaction log of temporary database was filled with connection to the worktable created by INSERT-EXEC statement. But I cannot see any insert lop insert operation trough extended events in temporary database. I just see extent allocation

SELECT * FROM #t2 WHERE database_id = 2

 If you have any idea whether worktables are logged and it is possible to trace them, please write a comment.


Incorrect estimation cardinality estimator

Since 2014 version of SQL server, there were implemented new approarches to help query optimizer  better understand your SQL query and data estimation, for example correlation in predicates on the same table, correlation in predicates between tables, that outdated statistics can have newer data, etc…

More info can be found here: https://bit.ly/37ddnoe

Motivation to write this article was that there could be situations the cardinality estimator could make things worse. I am experienced in one of my projects that query stopped to finish in expected time after upgrading SQL server to higher version (from 2008 to 2016). I prepared simple example simulating that situation:

Let’s create table dbo . WrongEstimationTable, which have multiple relationships with another one table dbo.SameTable. I left dbo.WrongEstimationTable
empty, that there will be no rows in result set. So we would expect that execution plan estimates that no rows will be returned.

CREATE TABLE dbo.WrongEstimationTable(id1 BIGINT, id2 BIGINT,id3 BIGINT,id4 BIGINT,id5 BIGINT)

Fill dbo.SameTable with some testing data.

CREATE TABLE dbo.SameTable (id BIGINT,identityid INT IDENTITY(1,1),typeid INT)
INSERT INTO dbo.SameTable(id,typeid) SELECT object_id,1 FROM sys.objects
INSERT INTO dbo.SameTable(id,typeid) SELECT object_id,2 FROM sys.objects

Create indexes to help the query to get the data as fast as possible. 

CREATE CLUSTERED INDEX CX_identityid  ON  dbo.SameTable(identityid )
CREATE UNIQUE  NONCLUSTERED INDEX    CX_id  ON  dbo.SameTable(typeid,id  ) INCLUDE (identityid)

Run the query bellow where dbo.SameTable correlates with dbo.WrongEstimationTable using typeid predicate. Show actual execution plan on older version of SQL server or switch off Cardinality estimator if you use new version of SQL server, query bellow.

SELECT * FROM 
         dbo.WrongEstimationTable t 
JOIN     dbo.SameTable s1 ON s1.id=t.id1 AND s1.typeid=1
JOIN     dbo.SameTable s2 ON s2.id=t.id2 AND s2.typeid=1
JOIN     dbo.SameTable s3 ON s3.id=t.id3 AND s3.typeid=1
JOIN     dbo.SameTable s4 ON s4.id=t.id4 AND s4.typeid=1
JOIN     dbo.SameTable s5 ON s5.id=t.id5 AND s5.typeid=1
OPTION (USE HINT('FORCE_LEGACY_CARDINALITY_ESTIMATION'))

See that optimizer estimates that on the second one table there are no data, so the number of rows and executions are very low – one, as expected.

Execution plan - old optimizer
Picture01 – Execution plan – old optimizer

Execution plan - old optimizer
Picture 02 – Execution plan – old optimizer

Running the same query on SQL server 2016 or earlier builds of SQL Server 2017 leads to very strange execution plan were optimizer expect increasing estimated number of rows in each branch of nested loop to 1024 estimated rows. As you can see on picture bellow. In production it could cause your query to prolong its execution time rapidly.

Execution plan - old optimizer
03 Execution plan – old optimizer

Execution plan - newer optimizer
Picture 04 – Execution plan – newer optimizer

As solution you can:

  1. Rewrite the query
  2. Use the old version of Query Optimizer – it comes with Cumulative update 10 for SQL server 2017 https://bit.ly/2r3YyDO
  3. Use the database compatibility level for 2008 (100)
  4. Switch off Cardinality Estimator use the old functionality of optimizer for Cardinality estimation
  5. Whatever I forgot

1.

SELECT id,identityid INTO #tmp FROM dbo.SameTable WHERE typeid=1
CREATE CLUSTERED INDEX CX_identityid ON #tmp(id) 
CREATE UNIQUE NONCLUSTERED INDEX CX_id ON #tmp( id ) INCLUDE (identityid)
SELECT * 
  FROM dbo.WrongEstimationTable t
  JOIN #tmp s1 ON s1.id=t.id1
  JOIN #tmp s2 ON s2.id=t.id2
  JOIN #tmp s3 ON s3.id=t.id3
  JOIN #tmp s4 ON s4.id=t.id4
  JOIN #tmp s5 ON s5.id=t.id5

2.

SELECT *
FROM dbo.WrongEstimationTable t
JOIN dbo.SameTable s1 ON s1.id=t.id1 AND s1.typeid=1
JOIN dbo.SameTable s2 ON s2.id=t.id2 AND s2.typeid=1
JOIN dbo.SameTable s3 ON s3.id=t.id3 AND s3.typeid=1
JOIN dbo.SameTable s4 ON s4.id=t.id4 AND s4.typeid=1
JOIN dbo.SameTable s5 ON s5.id=t.id5 AND s5.typeid=1
OPTION (USE HINT('QUERY_OPTIMIZER_COMPATIBILITY_LEVEL_100'))

3.

4.

SELECT *
FROM dbo.WrongEstimationTable t
JOIN dbo.SameTable s1 ON s1.id=t.id1 AND s1.typeid=1
JOIN dbo.SameTable s2 ON s2.id=t.id2 AND s2.typeid=1
JOIN dbo.SameTable s3 ON s3.id=t.id3 AND s3.typeid=1
JOIN dbo.SameTable s4 ON s4.id=t.id4 AND s4.typeid=1
JOIN dbo.SameTable s5 ON s5.id=t.id5 AND s5.typeid=1
OPTION (USE HINT('FORCE_LEGACY_CARDINALITY_ESTIMATION'))

I was not able to simulate above described situation on SQL server 2017 with cumulative update 10, https://bit.ly/35egiev, seems the issue was resolved.

When migrating or upgrading your current version of SQL Server to higher version you should check description of new features  or cumulative updates on MSDN. And you should be prepared on scenarios that things could be worse after your updates.

VARCHAR/NVARCHAR sizing/oversizing

It was not so long ago, we discusses with my colleagues what is the best VARCHAR/NVARCHAR sizing since these string data types allocate space in pages based on char-count stored in dynamically.

I remember that there is a saying that you should size our VARCHAR/NVARCHAR columns with size you really need. But from first sentence of this post and MSDN definition it seems that it does not matter. These data types could adapt on string you put in. Let’s have look on its little bit closer. This could not be answered by an easy way.

Create two tables with columns, type of VARCHAR and different size for each table. In my sample I created one with VARCHAR(20) and another one with VARCHAR(1000). (Do not use VARCHAR(MAX) since it is another story, I will describe in one of my next POSTs).

CREATE TABLE _varchar_20( id VARCHAR(20))
CREATE TABLE _varchar_1000( id VARCHAR(1000) )

Fill the tables with data with text size corresponding to the table column with the lover VARCHAR size. In my case 20, it means that the second table column will be oversized.

INSERT INTO _varchar_20
SELECT REPLICATE('1',20)
FROM sys.objects a
JOIN sys.objects b ON 1=1
JOIN sys.objects c ON 1=1

INSERT INTO _varchar_1000
SELECT REPLICATE('1',20)
FROM sys.objects a
JOIN sys.objects b ON 1=1
JOIN sys.objects c ON 1=1

Let’s check how tables differs from the storage point of view.

SELECT so.name, 
so.object_id,        sp.index_id,        sp.partition_id,        sp.hobt_id,        sa.allocation_unit_id,        sa.type_desc, sa.total_pages FROM sys.objects so JOIN sys.partitions sp on so.object_id = sp.object_id JOIN sys.allocation_units sa on sa.container_id = sp.hobt_id WHERE so.name IN ('_varchar_20','_varchar_1000')

As we can see there is no different. Number of allocated pages is the same for all tables.

Pages count
Picture 01 – Pages count

Now run simple select queries and compare execution plans to check if there is no impact on query execution.

SELECT * FROM     _varchar_20
SELECT * FROM _varchar_1000

It seems that both execution plans are the same at first look.

Simmple query plan comparation
Picture 02 – Simmple query plan comparation

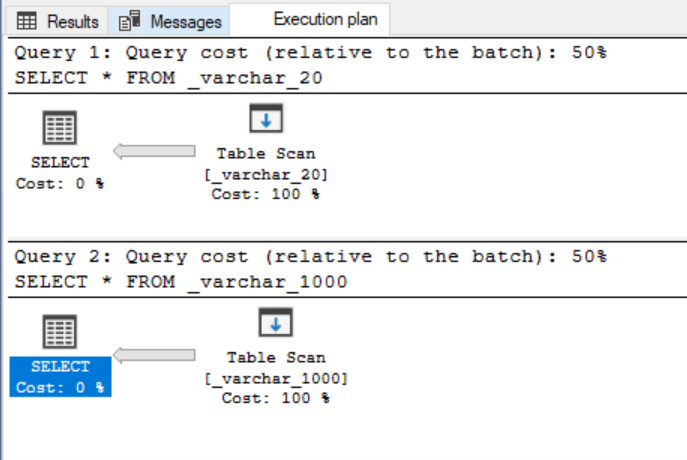
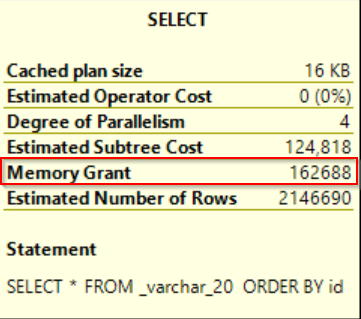
The only one counter differs – Estimated row size but it has evidently no impact on query execution.

 Estimated Row Size
Picture 03 – Estimated Row Size

Estimated Row Size

04 – Estimated Row Size

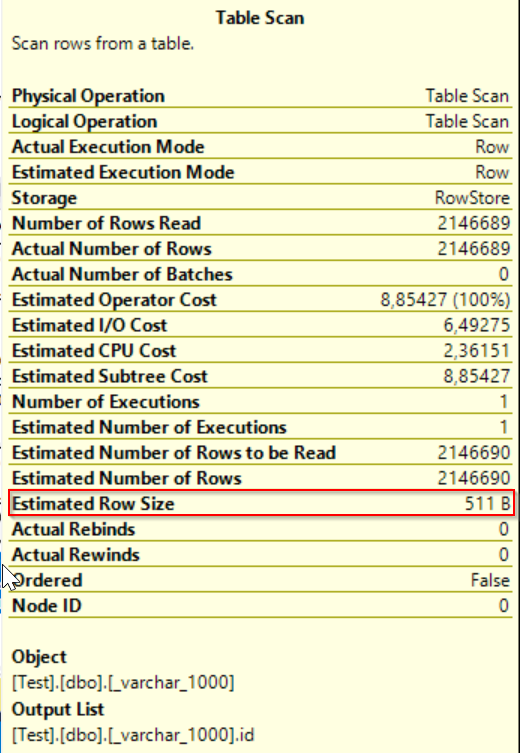
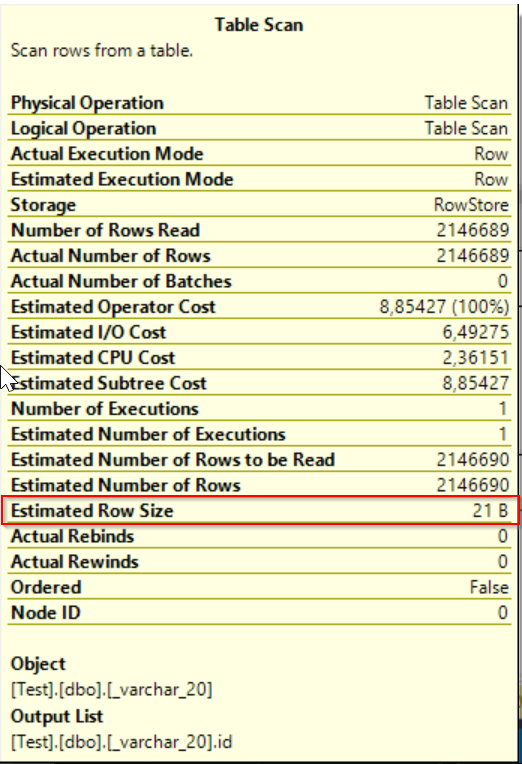
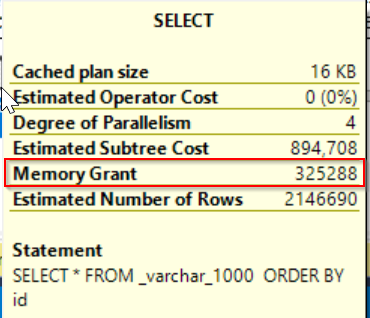
Now we could say that sizing of VARCHAR/NVARCHAR has no impact on storage and query execution. BUT let’s modify our queries with sort operators and run them again.

SELECT * FROM     _varchar_20 ORDER BY id

SELECT * FROM _varchar_1000 ORDER BY id

As you can see query getting data from smaller column VARCHAR/NVARCHAR sizing run with less query costs and pefroms much better. What happened?

query plan comparation
Picture 05 query plan comparation


Click on SELECT operator to see its properties for both queries. As you can see there appeared row with MEMORY GRANT meaning that query asked for memory reservation based on Estimated row count as I mentioned above. Sometimes optimizer does not look at the data really stored in objects and checks statistics or catalog schema info, etc. as in this case.

Picture 06 – memory grant

 memory grant

Picture 07 – memory grant

So we could see that little change in query caused different query plans and costs estimation with better performance for smaller VARCHAR/NVARCHAR sizing. 

My recommendation would states that it is better to size VARCHAR/NVARCHAR without oversizing columns when it is not really necessary.  Of course there could be scenarios that you expect that data could increase in time. But to increase length of your VARCHAR/NVARCHAR column is still easier job that if you have to reduce it. 

It would be interesting to take a look at this theme from more perspectives. I will continue with this topic in my next posts where I extend this theme to indexes, predicates, etc.  Stay tuned!